Drone, airborne and ground techniques: how they work and best uses.
Drone Magnetics Drone
UAV-borne magnetometer surveys
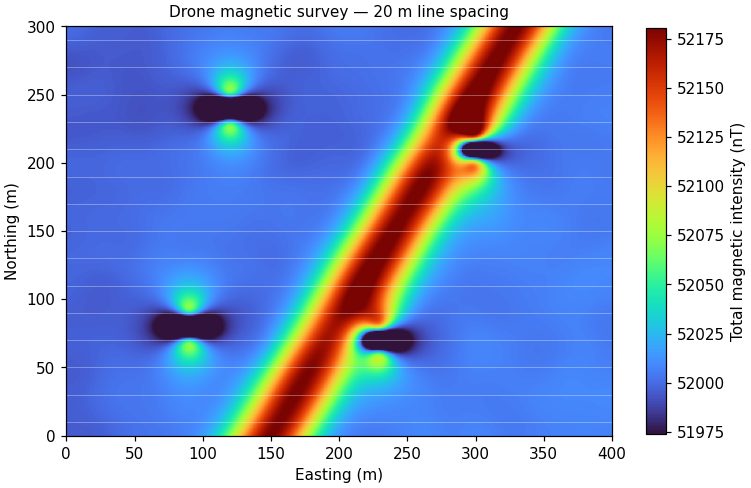
A lightweight magnetometer is flown beneath or ahead of a multirotor drone on pre-programmed lines. The instrument records the Earth's total magnetic field many times per second, and the processed grid shows where buried steel, magnetic rock units, faults and dykes disturb that field.
Terrain-following flight keeps the sensor at a steady height above ground. Data are corrected for diurnal variation using a base station, levelled between lines, and gridded. Derivative and reduced-to-pole products sharpen edges and place anomalies over their sources.
Drone Magnetics
Typical line spacing
5 – 50 m
Sensor height
2 – 60 m above ground
Production
25 – 100 line-km per day
Resolution
Sub-nT sensitivity, 10+ Hz sampling
Best for
Orphaned well casings and buried steel
UXO screening
Structural and lithologic mapping for mineral exploration
Steep, brushy or unsafe ground a field crew can't walk
Limitations: Responds only to magnetic materials. Non-ferrous targets such as plastic pipe, clay liners or voids need a different method.
Low-altitude drones now carry frequency-domain EM sensors and air-launched ground penetrating radar. These systems map near-surface conductivity and layering over areas that are wet, soft, contaminated or otherwise hard to reach on foot.
The drone flies a few metres above ground at walking speed. EM coils measure the secondary field induced in conductive ground; radar antennas record reflections from interfaces. Both are positioned with RTK GNSS so results tie directly to site coordinates.
Drone EM & GPR
Flight height
0.5 – 5 m above ground
EM depth
Up to ~6 m (sensor dependent)
GPR depth
Ice, fresh water, dry sand: tens of metres
Positioning
RTK GNSS, cm-level
Best for
Tailings and pond water/ice thickness
Soil salinity and moisture
Landfill boundaries
Snow and glacier studies
Limitations: Radar penetration drops sharply in clay and saline ground. Low flight height needs open terrain or careful planning.
Drone LiDAR & Photogrammetry Drone
Terrain models and orthomosaics
Every geophysical survey is easier to interpret on an accurate base map. We collect LiDAR point clouds and photogrammetric imagery by drone to produce bare-earth elevation models, contours and high-resolution orthomosaics.
LiDAR pulses pass through gaps in vegetation to reach the ground; photogrammetry reconstructs surfaces from overlapping photographs. Ground control and RTK positioning tie both to survey-grade coordinates.
Ground sample distance
1 – 3 cm (imagery)
Point density
100+ pts/m² (LiDAR)
Vertical accuracy
3 – 5 cm typical with control
Outputs
DEM, DSM, contours, orthomosaic
Best for
Terrain correction for gravity and magnetics
Flight planning for terrain-following surveys
Stockpile volumes and slope monitoring
Site base maps for reports
Limitations: Dense canopy reduces LiDAR ground returns; photogrammetry needs good light and texture.
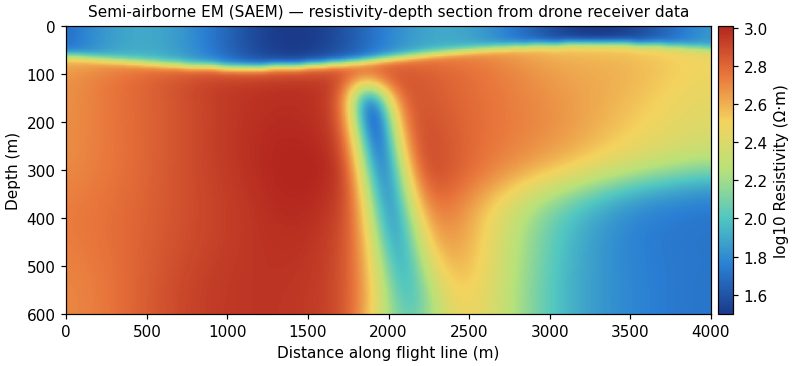
Semi-airborne electromagnetics pairs a grounded transmitter with a drone-borne receiver. A long cable laid on the ground drives a controlled, multi-frequency current into the earth, and a drone flies a magnetic-field sensor over the area to record the response. The result maps electrical resistivity to depths of several hundred metres, far deeper than other drone EM systems, without walking every line.
A grounded electric dipole, typically one to a few kilometres long, transmits a square-wave current at a set of frequencies. The drone tows a three-component induction-coil or fluxgate magnetometer on lines across and around the transmitter. Frequency-domain transfer functions are computed between the transmitted current and the received magnetic field, then inverted in 1D, 2D or 3D to resistivity-depth sections and volumes. One transmitter setup covers several square kilometres before it is moved.
Semi-Airborne EM (SAEM)
Transmitter
Grounded dipole, 1 – 4 km, 10 – 40 A
Frequencies
~10 Hz – 10 kHz
Receiver
3-component magnetometer on a drone, RTK positioned
Depth of investigation
Several hundred metres, ground dependent
Line spacing
50 – 200 m
Outputs
Resistivity-depth sections, depth slices, 3D models
Best for
Conductive mineralization: massive sulphides, graphite, alteration zones
Groundwater aquifers and saline interfaces at depth
Structural mapping beneath resistive or conductive cover
Steep, forested or restricted ground where ground EM is slow and helicopter EM is overkill
Limitations: Needs room and access to lay and ground the transmitter cable, and permission to inject current. Resolution decreases with depth, and strong cultural noise (power lines, pipelines, fences) must be planned around.
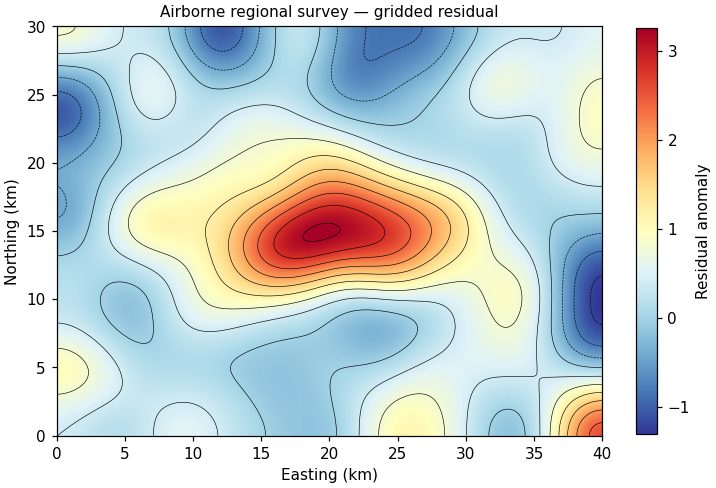
For areas measured in tens to thousands of square kilometres, helicopter and fixed-wing systems collect magnetics, time-domain EM, radiometrics and gravity. We design these programs, manage contractors, QC the data in the field and deliver the interpretation.
Survey aircraft fly parallel lines with tie lines for levelling. We specify line spacing, flight height and system to match the geological question, then check data daily against contract specifications before accepting it.
Airborne Geophysics
Coverage
100s – 1000s of line-km
Systems
Mag, TEM, FDEM, radiometrics, gravity
Line spacing
50 – 400 m typical
Our role
Design, contractor oversight, QC, interpretation
Best for
District-scale mineral and lithium exploration
Basin-wide groundwater mapping
Geothermal and structural studies
Targeting follow-up ground and drone work
Limitations: Mobilization cost makes small areas uneconomic. Drone surveys often fill the gap between ground and full airborne.
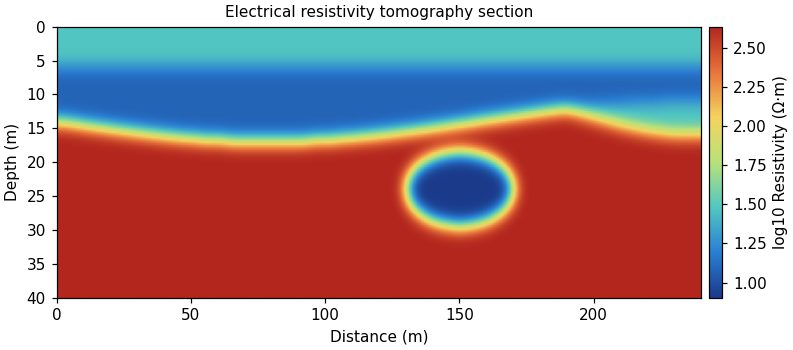
Electrical resistivity tomography (ERT) passes current through the ground between electrode pairs and measures the resulting voltage on many others. Inversion turns thousands of readings into a cross-section or volume of subsurface resistivity.
Clay, saline water and some ore minerals conduct; dry sand, gravel, fresh bedrock and voids resist. Mapping these contrasts outlines aquifers, contamination, fracture zones, bedrock depth and cavities.
Electrical Resistivity Tomography
Depth of investigation
~1/5 of array length (to 100+ m)
Electrode spacing
0.5 – 10 m
Arrays
Dipole-dipole, Wenner, Schlumberger, gradient
Formats
2D profiles, 3D grids, time-lapse
Best for
Aquifer and water-table mapping
Karst and void detection
Landfill and plume delineation
Dam and levee seepage
Limitations: Needs electrode contact with the ground, which is slow on pavement or frozen ground. Resolution decreases with depth.
Induced polarization (IP) is collected alongside resistivity and measures how the ground stores electrical charge. Disseminated sulfides, graphite and some clays hold charge and show up as chargeable zones.
After the transmitter current switches off, the voltage decays rather than dropping instantly. The size and shape of that decay (chargeability) is inverted with resistivity to map mineralized and altered ground.
Depth
Tens to several hundred metres
Measurements
Time-domain chargeability, spectral IP
Acquired with
ERT, same electrodes
Outputs
Resistivity + chargeability sections
Best for
Porphyry and disseminated sulfide exploration
Clay versus salt water discrimination
Landfill waste characterization
Limitations: Slower than resistivity alone and sensitive to cultural noise near fences and pipelines.
Frequency-domain electromagnetic (FDEM) instruments use a transmitter coil to induce currents in the ground and a receiver coil to measure the response. No ground contact is needed, so large areas can be mapped quickly on foot, by vehicle or by drone.
The quadrature component maps apparent conductivity; the in-phase component is highly sensitive to metal. Multi-coil and multi-frequency instruments give several depths at once.
Depth
0.5 – 6 m (instrument dependent)
Platforms
Handheld, cart, ATV, drone
Production
Hectares per hour
Outputs
Conductivity and in-phase maps
Best for
Buried drums, tanks and metal debris
Soil salinity and texture
Landfill boundaries
Pipeline and utility corridors
Limitations: Shallow penetration. Fences, vehicles and powerlines add noise that must be edited out.
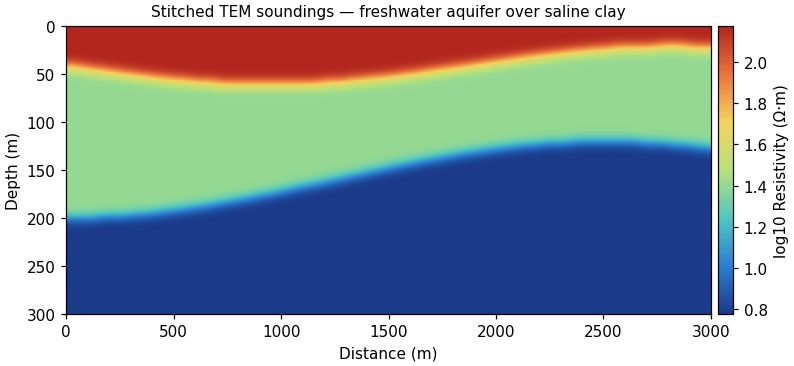
Time-domain EM (TEM) switches off a current in a large loop and records how induced currents diffuse into the ground. Early times see shallow layers and late times see deep ones, so each sounding gives a resistivity-depth profile.
Soundings are inverted into layered models and stitched into sections or 3D volumes. TEM sees through resistive cover to deep conductive targets and maps fresh/saline interfaces well.
Time-Domain EM
Depth
10 m to 500+ m
Loop size
20 – 400 m
Formats
Soundings, profiles, towed systems
Outputs
Stitched resistivity sections
Best for
Aquifer thickness and saltwater interface
Lithium brine exploration
Deep conductors in mineral exploration
Geothermal clay caps
Limitations: Poor resolution of thin resistive layers; sensitive to nearby metal infrastructure.
Ground magnetometer surveys map the same magnetic field as drones but at the highest possible resolution, with the sensor carried or towed close to the ground.
Gradiometer configurations cancel regional field changes and highlight shallow objects. Walking surveys cover tight grids around structures where flying is not practical.
Line spacing
0.5 – 25 m
Sensors
Cesium vapor, fluxgate, gradiometer
Sensitivity
0.01 nT
Outputs
TMI, gradient, analytic signal
Best for
UXO and buried metal
Archaeological features
Well casings in built-up areas
Detailed follow-up of drone anomalies
Limitations: Slower than drone coverage and affected by nearby steel buildings and vehicles.
Gravity surveys measure tiny variations in the Earth's gravitational pull caused by density differences below ground. They map basin depth, faults, dense ore bodies and, at microgravity scale, voids and cavities.
Each station is precisely leveled and positioned. Readings are corrected for drift, tides, elevation and terrain (which is why accurate drone-derived elevation models matter) to produce Bouguer and residual anomaly maps.
Ground penetrating radar (GPR) transmits short radio pulses into the ground and records reflections from buried objects and layer boundaries. It gives the highest resolution of any surface method in the upper few metres.
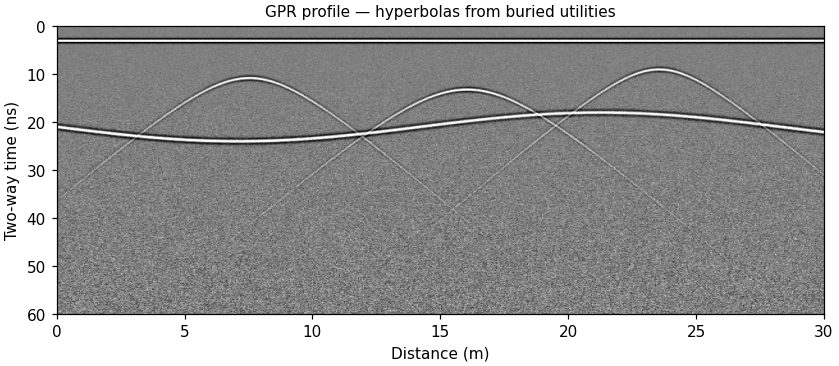
Antenna frequency sets the trade-off: high frequencies resolve rebar in concrete, low frequencies see deeper into soils. Hyperbolic reflections mark pipes and point targets; continuous reflectors mark layers and bedrock.
Ground Penetrating Radar
Frequencies
40 MHz – 2.6 GHz
Depth
Centimetres to ~20 m (ground dependent)
Platforms
Cart, handheld, vehicle, drone
Outputs
Profiles, depth slices, 3D volumes
Best for
Utility locating
Concrete scanning
Unmarked graves and archaeology
Ice and water depth
Limitations: Clay and saline soils absorb the signal and can limit penetration to less than a metre.
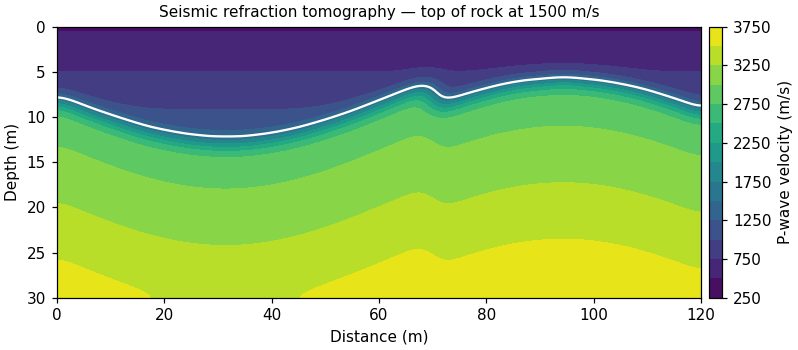
Seismic methods time sound waves from a hammer, weight drop or other source as they travel through the ground. Refraction tomography maps velocity and rippability; reflection images layer geometry at greater depth.
Geophones along a line record first arrivals. Velocity increases from soil to weathered to fresh rock, so the velocity model shows depth to bedrock and weak zones.
Seismic Refraction & Reflection
Depth
5 – 100 m typical
Geophone spacing
1 – 5 m
Sources
Sledgehammer, weight drop, accelerated source
Outputs
Velocity tomograms, rippability
Best for
Depth to bedrock
Rippability for excavation
Landslide failure surfaces
Dam and foundation sites
Limitations: Refraction cannot see a slower layer beneath a faster one. Traffic and wind add noise.
Multichannel analysis of surface waves (MASW) and passive methods such as HVSR measure shear-wave velocity, which is tied directly to soil stiffness and seismic site class.
Surface-wave dispersion is extracted from recorded data and inverted for shear-wave velocity with depth. Passive recordings use ambient noise and work in urban settings.
Borehole logging lowers probes down wells to measure natural gamma, resistivity, conductivity, temperature, fluid flow and acoustic or optical images of the borehole wall.
Logs tie surface geophysics to real geology, identify productive zones, locate fractures and verify well construction.
Logs
Gamma, resistivity, EM induction, temperature, fluid
Imaging
Optical and acoustic televiewer
Depth
To ~1,000 m (tool dependent)
Outputs
Composite logs, fracture analysis
Best for
Water well screen placement
Fracture mapping
Calibrating surface resistivity
Mineral exploration drill holes
Limitations: Requires an open or suitably cased hole.
Towed resistivity streamers, boat-mounted GPR, magnetometers and bathymetric sonar extend our methods onto ponds, reservoirs and rivers.
Instruments are mounted on small boats or remotely operated vessels with GNSS positioning. Results combine water depth, sediment thickness and sub-bottom geology.
Environments
Ponds, reservoirs, rivers, tailings ponds
Methods
Towed ERT, GPR, mag, sonar
Vessels
Small craft and remote boats
Outputs
Bathymetry, sediment thickness
Best for
Tailings pond sediment
Groundwater/surface water exchange
Dam and intake inspection
Sediment volume for dredging
Limitations: Weather and water access control scheduling.
Connect with us
Let's talk about your project.
Send a location and the question you need answered. We'll recommend a method and a budget range.